
A sales CRM can always help improve sales performance and measure the effectiveness of sales strategies.
However, to measure sales and marketing performance metrics, you need to know which metrics and key performance indicators (KPIs) to track.
We’re going to explore the essential metrics and KPIs that businesses should track to measure their performance accurately.
Importance of metrics and KPIs
Measuring sales performance with CRM metrics and KPIs is essential to improving sales performance and optimizing sales strategies. By tracking the right metrics and KPIs, businesses can make data-driven decisions, identify areas for improvement, and optimize their sales process.
Use the data to set goals and targets, provide sales training and coaching, and celebrate successes. By using metrics and KPIs to improve sales performance, businesses can achieve their revenue goals and grow their business!
What is a CRM, and why is it important?
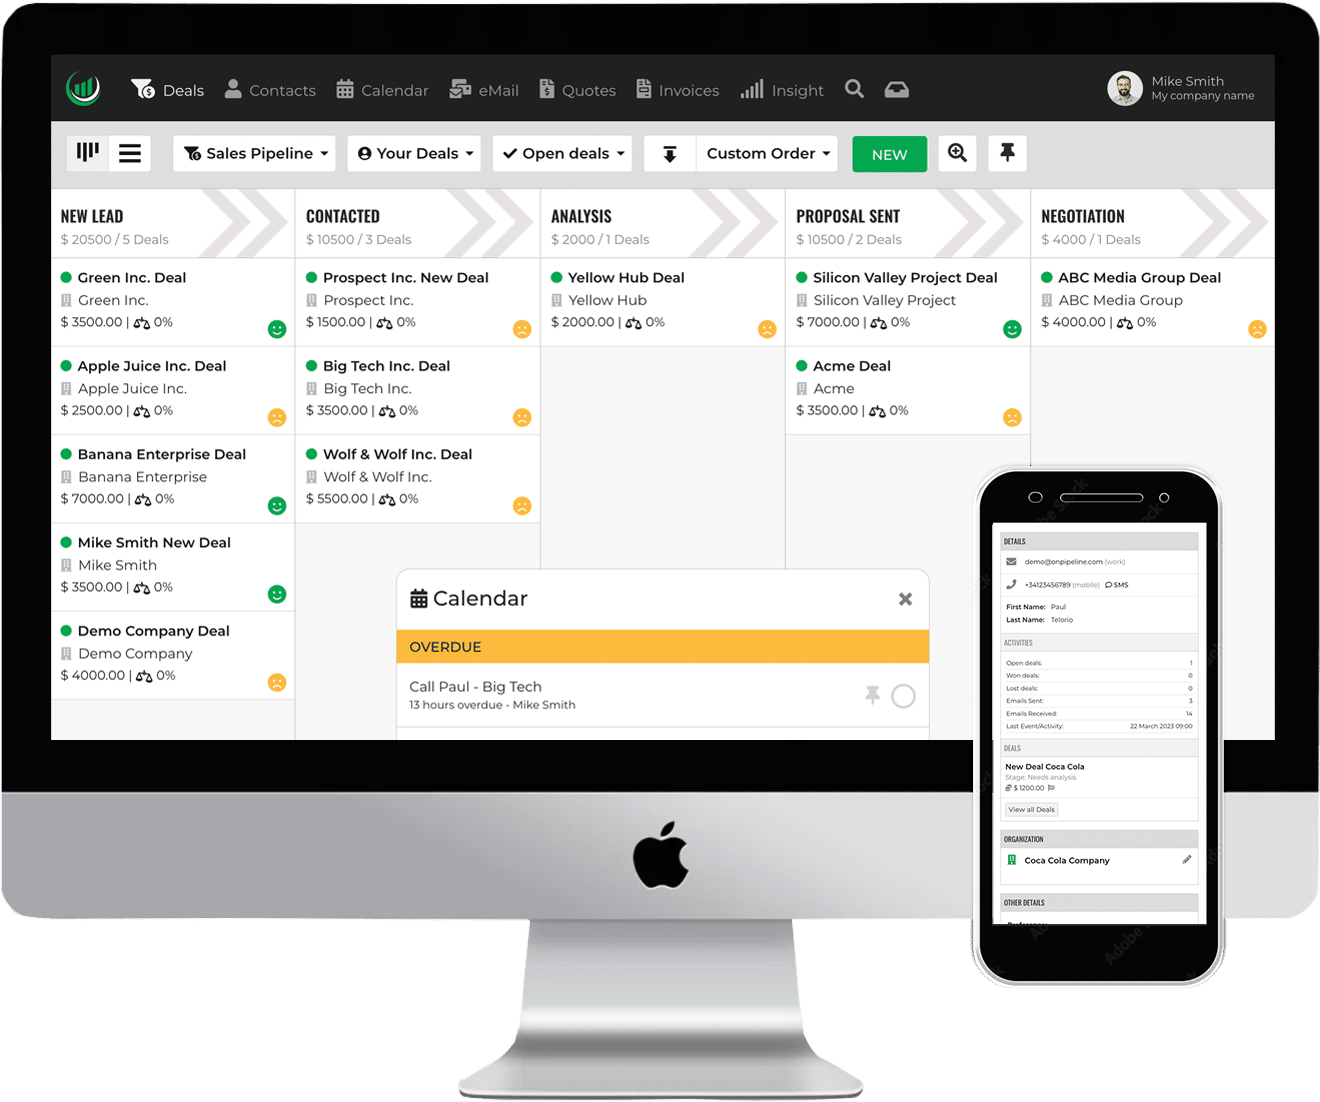
Customer Relationship Management (CRM) software is designed to manage customer interactions and track sales activity. Sales teams use CRM software to manage leads, deals, and customer accounts. It allows businesses to automate repetitive sales tasks, track sales activity, and analyze sales data.
A CRM can be a game-changer for businesses looking to improve their sales performance. By tracking sales activity and customer interactions, businesses can make data-driven decisions and optimize their sales strategies. However, without the right metrics and KPIs, it’s challenging to measure the effectiveness of your sales team accurately.
Essential Metrics to Track Sales Performance
1. Sales Growth
Sales growth is a key metric that measures the increase or decrease in revenue over a specific period. It’s essential to track sales growth to identify trends and make data-driven decisions. By tracking sales growth, businesses can evaluate the effectiveness of their sales strategies and make necessary adjustments.
To calculate sales growth, use the following formula:
Sales Growth = (Revenue in Period – Revenue in Previous Period) / Revenue in Previous Period
2. Sales Velocity
Sales velocity is a metric that measures how quickly sales reps close deals. It’s calculated by dividing the number of deals closed by the average length of the sales cycle. Sales velocity is an essential metric to track because it helps identify bottlenecks in the sales process.
To calculate sales velocity, use the following formula:
Sales Velocity = Number of Deals / Sales Cycle Length
3. Customer Acquisition Cost (CAC)
Customer Acquisition Cost (CAC) is a metric that measures the cost of acquiring a new customer. It includes the cost of sales and marketing efforts, such as advertising, events, and sales commissions. By tracking CAC, businesses can determine the ROI of their sales and marketing efforts.
To calculate CAC, use the following formula:
CAC = (Sales and Marketing Costs / Number of New Customers Acquired)
4. Customer Lifetime Value (CLV)
Customer Lifetime Value (CLV) is a metric that measures the total value of a customer over their lifetime. It includes the revenue generated by the customer and the cost of serving them. By tracking CLV, businesses can identify their most profitable customers and focus their sales and marketing efforts accordingly.
To calculate CLV, use the following formula:
CLV = (Average Value of a Sale / Churn Rate) x Average Customer Lifespan
5. Lead Conversion Rate
Lead Conversion Rate is a metric that measures the percentage of leads that turn into customers. It’s an essential metric to track because it helps identify the effectiveness of your lead generation and sales processes.
To calculate Lead Conversion Rate, use the following formula:
Lead Conversion Rate = (Number of Converted Leads / Total Number of Leads) x 100
Key Performance Indicators (KPIs) to Track Sales Performance
6. Monthly Sales Revenue
Monthly sales revenue is a KPI that measures the amount of revenue generated by the sales team each month. It’s an essential KPI to track because it provides a clear picture of sales performance over time.
7. Sales Pipeline Value
Sales Pipeline Value is a KPI that measures the total value of deals in the sales pipeline.
8. Average Deal Size
Average Deal Size is a KPI that measures the average value of a closed deal. It’s important to track this KPI to identify trends and make data-driven decisions. By analyzing Average Deal Size, businesses can identify opportunities to increase revenue and optimize their sales strategies.
9. Win Rate
Win Rate is a KPI that measures the percentage of deals won by the sales team. It’s essential to track this KPI to evaluate the effectiveness of your sales process and identify areas for improvement. By analyzing Win Rate, businesses can identify common reasons for lost deals and make necessary adjustments.
10. Sales Cycle Length
Sales Cycle Length is a KPI that measures the length of time it takes to close a deal. It’s important to track this KPI to identify bottlenecks in the sales process and optimize sales strategies. By analyzing Sales Cycle Length, businesses can identify opportunities to shorten the sales cycle and close more deals.
Metrics and KPIs to Improve Sales Performance
Tracking the right metrics and KPIs is essential to improving sales performance. However, it’s not enough to track these metrics and KPIs; businesses need to use the data to make informed decisions and optimize their sales strategies. Here are some tips for using metrics and KPIs to improve sales performance:
Identify areas for improvement
Use the data to identify areas of the sales process that need improvement. For example, if the Win Rate is low, analyze the data to identify common reasons for lost deals.
Optimize your sales process
Use the data to optimize your sales process. For example, if the Sales Cycle Length is long, identify bottlenecks in the process and make necessary adjustments.
Set goals and targets
Use the data to set goals and targets for the sales team. For example, set a target for the Win Rate or Sales Pipeline Value and track progress over time.
Provide training and coaching
Use the data to provide training and coaching to the sales team. For example, if the Lead Conversion Rate is low, provide training on effective lead generation and follow-up strategies.
Celebrate successes!!
Use the data to celebrate successes and motivate the sales team. For example, if the Sales Growth is high, celebrate the achievement and recognize the team’s hard work.